Detecting Insulin Sensitivity Changes for Individuals with Type 1 Diabetes with Autosensitivity from #OpenAPS – Poster Presented at American Diabetes Association Scientific Sessions (#2018ADA)
Members of the OpenAPS community submitted an abstract that was accepted for a poster presentation at the American Diabetes Association’s 2018 Scientific Sessions meeting. This poster was co-authored by Dana Lewis, Tim Street, Scott Leibrand, and Sayali Phatak. The embargo lifted this morning, so you can read below for the content from the poster to get insight about autosensitivity as a method for real-time and retrospective analyses of changing insulin needs over time.
BACKGROUND:
A method to calculate changes in insulin needs was developed in the OpenAPS (Open Source Artificial Pancreas System) community. Individuals have natural fluctuations in insulin needs, but excessive periods of sensitivity or resistance may indicate ongoing physiological trends and therefore impact T1D management. It can be challenging for individuals with T1D to identify in real-time (or near real-time) factors that influence sensitivity/resistance, and adjust insulin dosing in response to the changing trends.
Autosensitivity (referred to as “autosens”) was developed as part of the open source, do-it-yourself hybrid closed loop (OpenAPS) to reduce the burden in responding to these changes in real life. It is designed to adjust proportionally to the changes in insulin sensitivity. It therefore differs from “Autotune”, which recommends adjustments to underlying ISF, carb ratio, and basal rates for insulin pump settings.
METHODS:
- Autosens analyzes each CGM data point for 24 hours, comparing observed change to expected impact from insulin.
- Autosens calculates the deviation for the median of the last 8 and 24 hours of CGM data points and determines the sensitivity ratio (SR) required to neutralize the median deviation.
- Autosens was run retrospectively to obtain an hourly SR value (first calculated SR every hour) for (N=1)*16 individuals using OpenAPS. There were 13 adults, and 3 kids (<18) in this data set.
- M = 5393 data points, range = 922 to 20,473.
- (Note: while ISF could be obtained for any time frame greater than 5 minutes, it was determined that one ISF calculation per hour was a useful sample rate to assess changes through the day.)
- A SR of >1.0 indicates resistance; <1.0 indicates sensitivity. Histograms were created to visualize SR for each participant.
- Mean SR ± SD was calculated and those falling beyond ± 10% of 1.0 were classified as being resistant and sensitive respectively.
RESULTS:
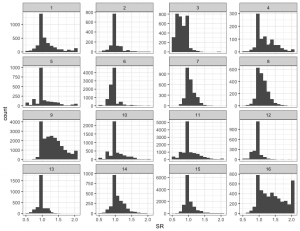
- Person 3 trended toward sensitivity [0.79 ± 16]; indicating underlying basal rates and other settings may need to be adjusted
- Persons 4, 9, and 16 trended toward resistance [1.2 ± 0.28; 1.33 ± 0.30; 1.41 ± 0.37]; indicating that an increase in basal rates and other settings may be of benefit.
CONCLUSION:
- Idiographic visualization of SR can be useful for detecting overall patterns of sensitivity/resistance potentially unaccounted for by the user’s pump settings.
- This approach can be useful for understanding real-time changes to adjust insulin dosing, as well as retrospective analyses to understand patterns of changes.
- Many dozens of individuals are using autosensitivity in real-time to automatically adjust insulin dosing as part of DIY-closed loop systems (OpenAPS and AndroidAPS).
- Future studies using the retrospective autosensitivity method to detect insulin sensitivity changes could be used on the following topics:
- Understanding growth/hormone-related sensitivity changes, including better knowledge about the impact of the menstrual cycle
- Better understanding circadian profiles and monthly variation of insulin sensitivity needs
- Illustrating correlation with insulin pump site change patterns
—
You can find out more about OpenAPS here on OpenAPS.org, from the reference design to frequently asked questions (such as what hardware is needed and where the code and documentation can be found) and links to news articles on OpenAPS community. Documentation for individuals seeking to set up DIY closed loops themselves following the OpenAPS reference design is available here.